Do you know your bill, but have no idea why it’s that high?
If your bills keep rising but nothing explains why, we install IoT sensors across your facility, find exactly where your money is going, and cut energy costs by 15 to 35%, without replacing a single piece of equipment.
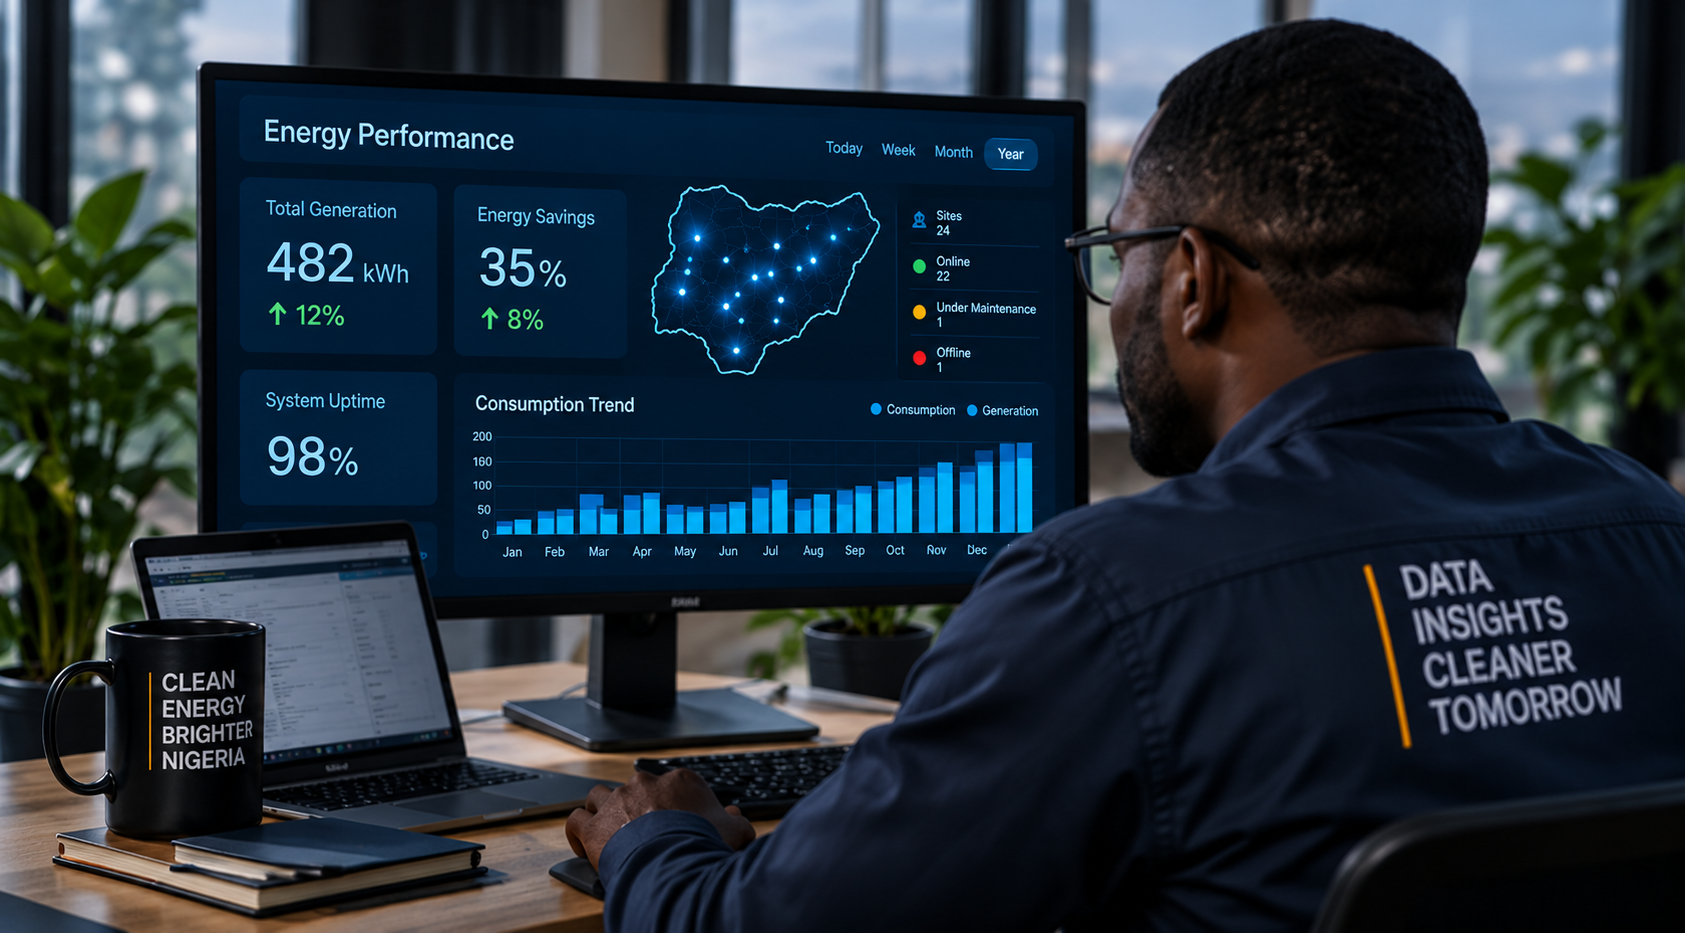
Your bill tells you what you spent. Not why.
Most Nigerian homes and businesses have no idea where their energy spend goes. They reduce hours and remind staff to switch things off, yet the bill barely moves. That is because the waste is not where they are looking.
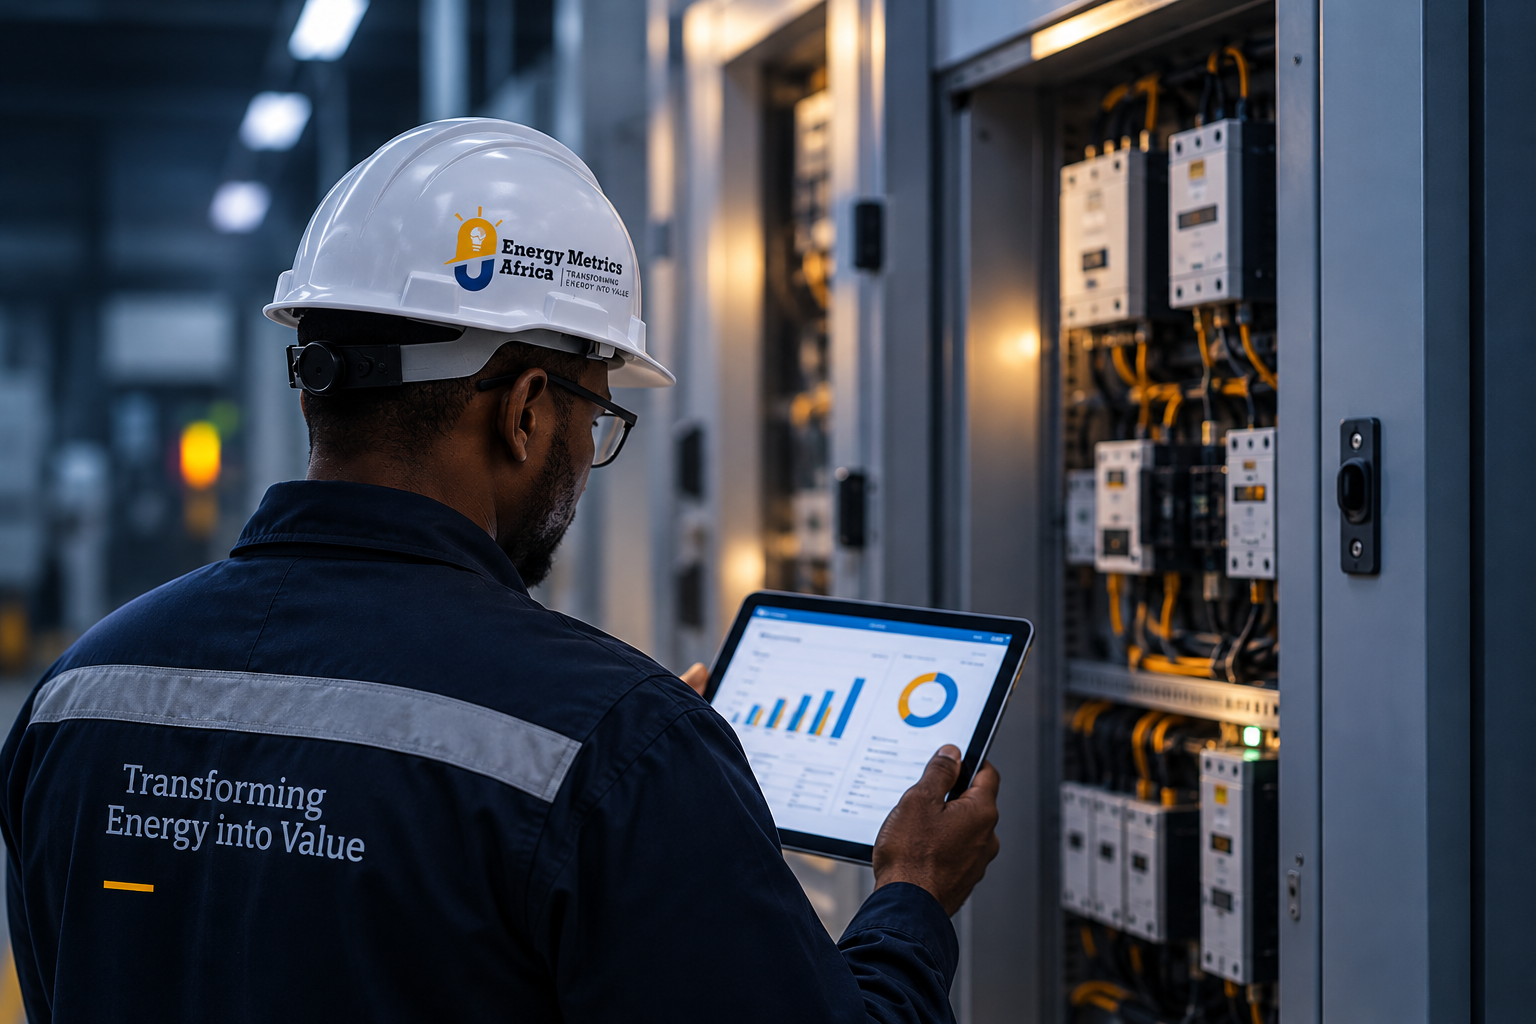
We put our eyes on every circuit.
Then we tell you exactly what to fix.
We install IoT sensors across your facility. Within 14 days, we have a complete picture of your consumption: by circuit, by hour, and by equipment. We identify every source of waste, calculate the cost of each one, and give you a ranked action list.
Six Things We Actually Check.
Equipment-Level Consumption
Every major load profiled individually, not estimated.
Peak Demand Patterns
The hours and equipment causing your highest tariff charges.
Power Quality
Voltage fluctuations, harmonics, and power factor issues costing you money silently.
Idle & Standby Waste
The equipment drawing load when your facility is closed.
Tariff Optimisation
Whether your current tariff band matches your actual usage pattern.
Billing Accuracy
Whether what you are being charged matches what you are actually consuming.
Assessment to savings report in 30 days.
Site assessment
We map your facility and identify the major loads. It takes one day and does not disrupt your operations.
Sensor installation
We install IoT meters across your panels, circuits and major equipment. This usually takes one to two days, and your operation continues as normal.
14 days of data
We collect live consumption data across the facility for 14 days, a clear picture of what each circuit is using, when it is using it, and where your peak and off-peak consumption sits.
Analysis
Our engineers go through the data to find where energy is being wasted, then put a monthly cost on each issue so you can see what those inefficiencies are actually costing you.
Savings report
A ranked list of the opportunities we found. For each one, what it will cost to fix, how much you could save each month, and how long it should take to pay for itself. No jargon, just numbers you can use.
Implementation support
We stay involved while the changes are being made. You will know exactly what needs to change, what work is required, and what the expected result should be.
Typical monthly energy cost reduction
Data collection period
Assessment to action plan
Equipment replacements required for initial savings
Frequently Asked Questions.
We calculate them from your actual consumption data. Not industry benchmarks. Not generic estimates. We use your data, your equipment and your electricity tariff to work out where the money is going and what you could save.
That’s a good start. But a policy can only go so far. In our experience, policy-level changes typically account for about 5–10% of the available savings. The other 20–25% often comes from equipment faults, poor settings and operating behaviour that you will not spot without looking at the actual data.
It depends on the size of your facility and how much we need to measure. For operations spending more than ₦300,000 a month on electricity, the audit cost is typically recovered within the first month of implementing the findings. We will show you the numbers before you proceed.
Not to find the first round of savings. In the audits we have conducted, the initial savings have come from things like configuration changes, correcting faults and carrying out maintenance. In other words, you may not need to buy new equipment to start saving.
Every EMA energy audit includes:
From the first site assessment to the final savings report, we give you the data and support needed to act.
Site assessment and sensor placement plan
14 days of live consumption data collection
Ranked savings report with cost and payback per item
Implementation support through the fixing phase
IoT hardware installation across all major circuits
Full facility energy analysis by our engineers
Tariff and billing accuracy review
Ongoing monitoring option post-audit
Find out what your facility is actually costing you.
A 20-minute call is all it takes. Tell us your facility size and current energy spend. We tell you whether an audit makes sense and roughly what you can expect to find.
Describe your facility
You share your facility and current energy spend.
We check the payback
We tell you honestly whether an audit pays back quickly.
Free site assessment
If it does, we book a free site assessment.
You get your savings report
We install sensors, collect data, and deliver the findings.
You decide
You choose exactly what to act on, and when.
Free site assessment · No obligation